Back to projects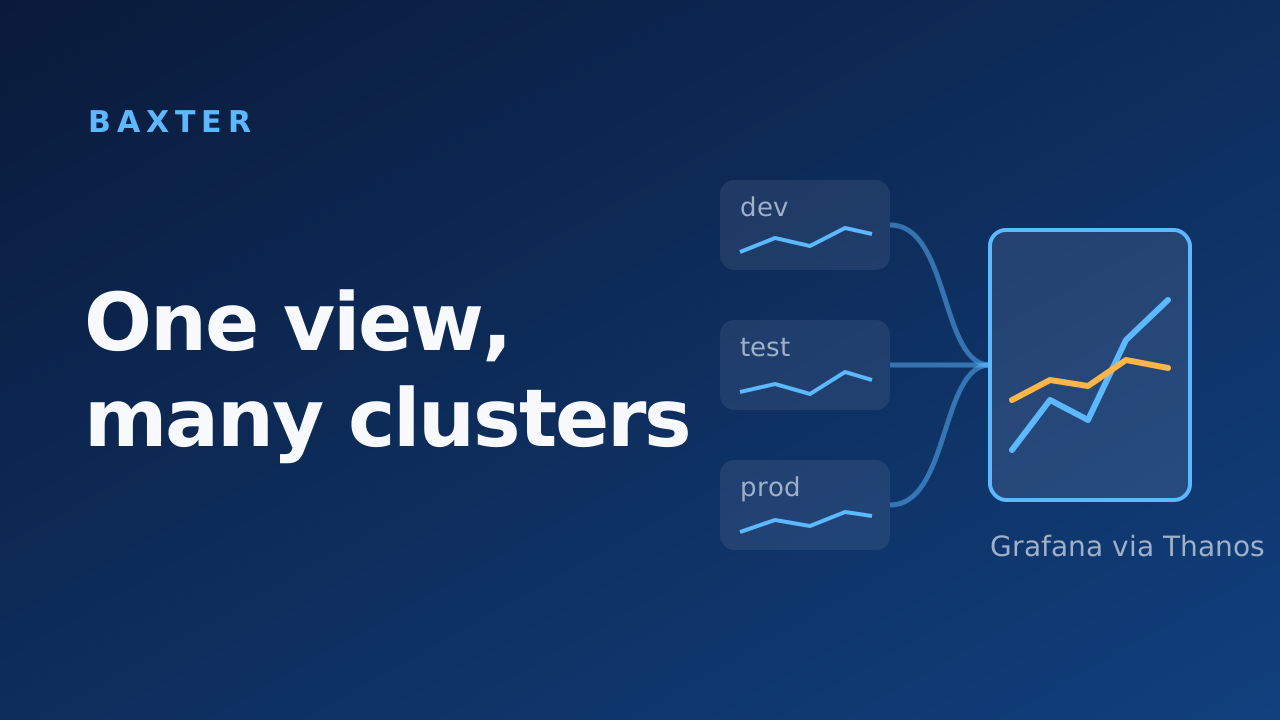
BaxterDec 2023
Multi-Cluster Monitoring with Prometheus & Thanos
Built one monitoring view across dev, test, and prod clusters with Prometheus, Thanos, and Grafana, with long-term metrics in S3, custom Python exporters, and alerting rules.
Context: Baxter International (Healthcare)
Problem
I managed many Kubernetes clusters across dev, test, and prod, and the team wanted to monitor all of them in one place. A Prometheus instance in each cluster meant separate dashboards per cluster. Prometheus federation needed too much duplication and had no real high availability or long-term storage, so it didn't fit a production multi-cluster setup.
Approach
- Central and workload clusters. Each workload cluster runs kube-prometheus-stack with a Thanos sidecar next to Prometheus. The central cluster also runs Grafana and the Thanos Query, Store, and Compactor components.
- Global queries. Thanos Query reads recent data from every sidecar over gRPC, exposed through an AWS Network Load Balancer, and historical data through Thanos Store. Every series carries
clusterandenvexternal labels. - Long-term storage in S3. Sidecars upload metric blocks to S3 every two hours, and the Compactor optimizes and downsamples them. Local Prometheus retention dropped to 6 hours on EFS-backed volumes, enough to cover upload gaps.
- Dynamic dashboards. Grafana's multi-cluster support with dashboard variables lets one dashboard switch between clusters and environments.
- Custom exporters. I wrote Prometheus exporters in Python with
prometheus-client, deployed with a Deployment, Service, and ServiceMonitor so Prometheus discovers them automatically. - Alerting. I designed custom Prometheus alerting rules with issue descriptions in each alert, so whoever is on call knows where to start.

Impact
- One Grafana view across all clusters and environments instead of one per cluster.
- Metrics are kept long term in S3 at low cost, instead of being limited by local Prometheus retention.
- Alerts arrive with context, which speeds up problem resolution.
Write-ups
- Theory: Monitoring with Prometheus & Thanos (Part 1/2)
- Full Installation: Monitoring with Prometheus & Thanos (Part 2/2)
- Writing Custom Prometheus Exporters in Python for Kubernetes
- Code: danielstankw/Thanos_prometheus
Stack
Prometheus · Thanos · Grafana · Alertmanager · Python · Kubernetes (EKS) · AWS S3 · Helm